Why Good Abstractions Make Debugging Harder in Real-World Systems
Good abstractions help when they reduce the search space and make ownership clear. They make debugging harder when they duplicate state, hide propagation rules, and let several layers stay locally correct while the system becomes globally inconsistent.
Introduction
Good abstractions are supposed to make software easier to understand. In production, they often do the opposite: they hide ownership, split state across layers, and create several locally correct views of the same data.
That is why debugging a real-world web system is rarely a matter of reading one stack trace or checking one function. It is more like reconstructing a chain of state transitions across frontend caches, backend services, databases, and asynchronous events.
This article argues a simple point: abstractions help debugging only when they reduce the search space and preserve a clear execution model. When they duplicate state or obscure propagation rules, they make incidents harder to reason about. The result is a system that behaves consistently inside each layer but inconsistently across the whole.
Scope and terms
Before going further, let’s define the terms used in this article.
What “abstraction” means here
In this article, an abstraction is any layer that hides implementation details behind a simpler interface. That can be a React component, a query cache, a service boundary, a Redis cache, or an event consumer. Abstractions are useful because they reduce complexity, but they also hide the mechanics that matter during incidents.
What “search space” means here
The search space is the set of possible places where the bug could live. A good abstraction narrows that space. A bad abstraction expands it by introducing duplicate state, hidden side effects, or invisible propagation delays.
What “ownership” means here
Ownership means which layer is responsible for the canonical value at a given point in time. If multiple layers think they own the same state, debugging becomes a reconciliation problem instead of a local fix.
What “clear execution model” means here
A clear execution model means the system’s behavior is predictable enough that you can trace cause and effect. If you can follow a mutation from request to persistence to cache to UI, the abstraction is helping. If each layer applies its own hidden rules, the abstraction is hiding the real system.
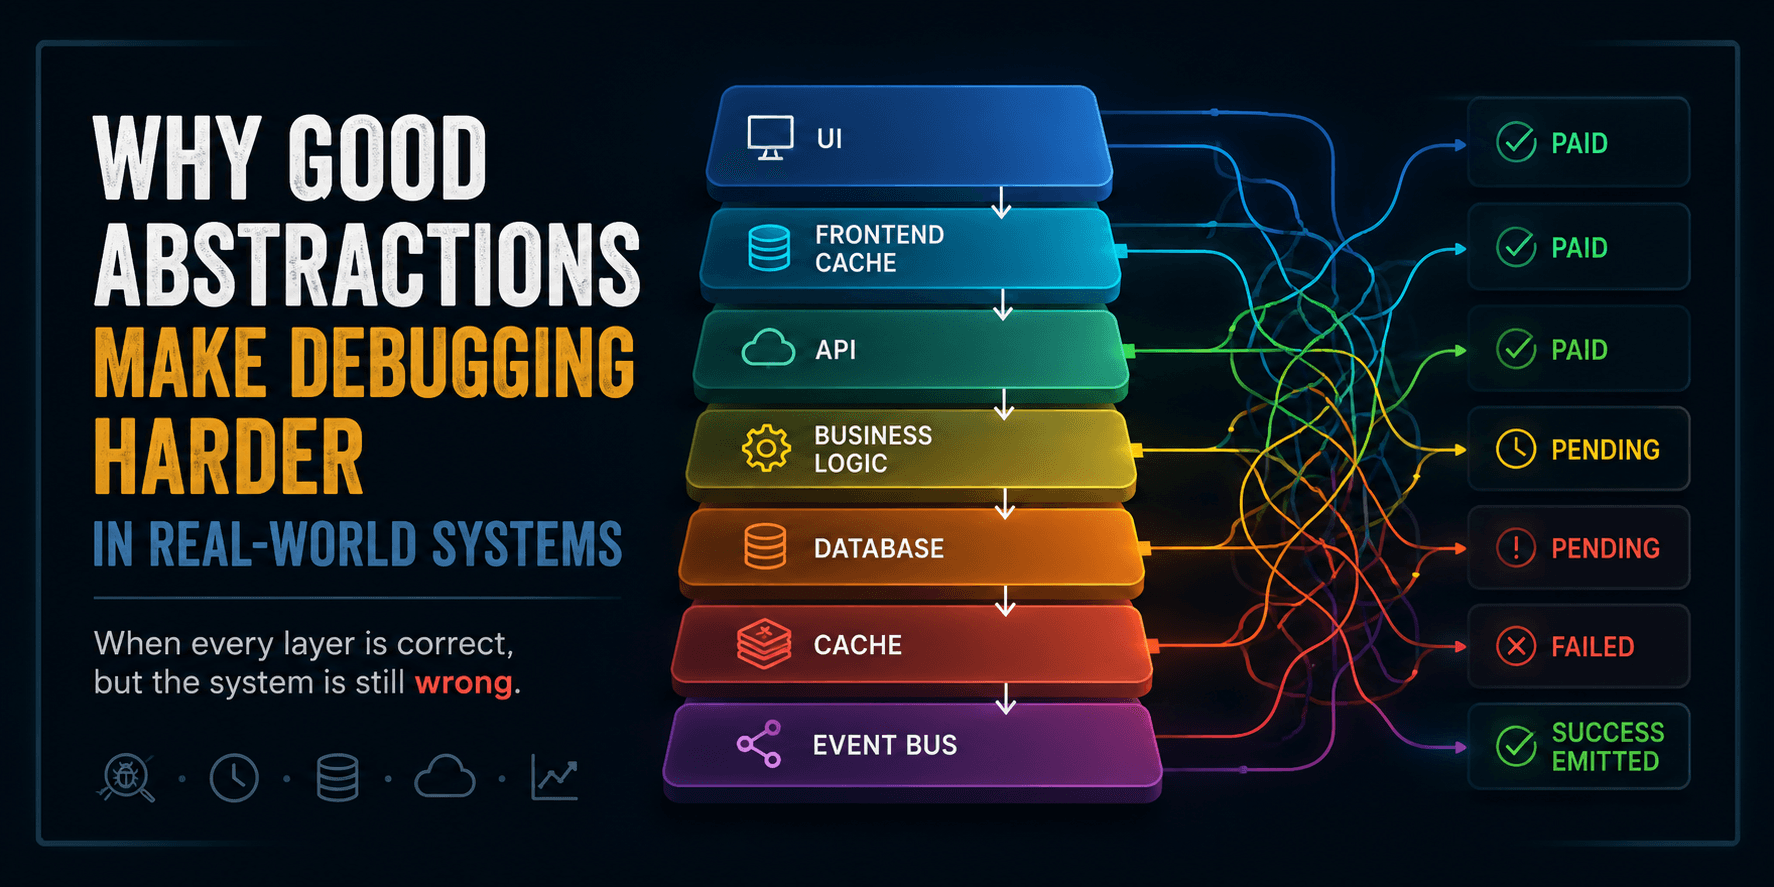
Real production symptom
A typical incident in a production React/Next.js/Node.js system does not look like a single obvious failure. It looks like disagreement between layers:
The UI displays incorrect state.
The API response is correct.
Backend logs show successful execution.
The database state differs from cache state.
The event log shows a different outcome again.
A concrete version of that might look like this:
UI:
PAIDAPI:
PAIDDB:
PENDINGRedis:
FAILEDEvent log:
SUCCESS emitted
Each layer is internally correct under its own assumptions. The system is globally inconsistent because no single layer owns the full truth.
That is the key difficulty: production systems are not just applications. They are state propagation systems, where data is copied, transformed, cached, invalidated, and re-emitted across boundaries. Once a state exists in more than one place, debugging becomes an exercise in reconciliation rather than inspection.
State propagation model
A useful way to think about modern systems is as a state ownership graph. Instead of asking, “Where is the bug?”, ask:
Where is state created?
Where is state mutated?
Where is state cached?
Where is state read?
Which component is authoritative at each step?
A simplified propagation path may look like this:
UI State
  ↓ optimistic update
Frontend Cache (React Query / RTK Query)
  ↓ HTTP boundary
API Gateway
  ↓
Service Layer
  ↓
Database
  ↓
Redis / CDN Cache
  ↓
Event Bus
  ↺ async feedback loop
This model matters because each layer has its own consistency contract. The frontend may be optimistic. The cache may be time-based. The database may be transactional. The event bus may be asynchronous and retryable. None of these guarantees automatically compose into one global consistency model.
If a user sees stale UI, the bug may not be in the UI at all. It may be in the cache invalidation step. If the database is correct but the event consumer is wrong, the fault may be in the propagation path after the write. If a service returns the right response but another service disagrees later, the issue may be ordering, deduplication, or an eventual consistency delay.
Why abstractions make debugging harder
Abstractions become painful when they increase the number of local truths.
A component, service, cache, or consumer can each be “correct” in isolation while still producing the wrong system outcome. That is the core debugging problem in distributed systems: local correctness does not guarantee global correctness.
The hidden cost
A good abstraction usually hides details that are irrelevant most of the time. But during an incident, those hidden details become exactly the information you need:
What is the canonical source of truth?
Was the cache invalidated?
Was the event emitted before or after the commit?
Did the consumer process the message twice?
Was the frontend reading from query cache or Redux?
Did a retry happen with a stale payload?
If the abstraction does not expose those answers clearly, debugging becomes slower.
The visibility problem
The worst abstractions are not the ones with the most code. They are the ones that hide the most meaning. If a layer can disagree with another layer without failing loudly, it is harder to debug than a layer that crashes immediately.
That is why some bugs are so frustrating: every layer logs success, but the business state is still wrong.
Common failure patterns
A lot of real incidents fall into a few repeatable categories.
Stale read
A layer returns outdated state after a valid mutation.
Typical sources:
CDN cache.
Redis TTL.
React Query staleTime.
Browser HTTP cache.
Typical symptom:
DB = updated.
UI = old.
This class is especially common when the write path succeeds but the read path is still served from a cache that was not invalidated or refreshed on time.
Lost update
A valid write gets overwritten by another concurrent write.
Typical sources:
Concurrent API requests.
Non-atomic reducers.
Last-write-wins behavior without locking.
Typical symptom:
Write A.
Write B.
Final state = A.
This is less about visibility and more about concurrency. The problem is not that the system forgot a write; it is that two writes raced and one silently won.
Ghost update
State is updated in one layer but not propagated to others.
Typical sources:
Missing cache invalidation.
Partial frontend cache update.
Skipped Redux dispatch after mutation.
Typical symptom:
API = new.
UI cache = old.
Redux store = old.
This failure is especially confusing because one component reports success while another continues to serve an old value. The bug is not in the mutation itself; it is in the handoff between layers.
Event reorder inconsistency
Events are applied in a different order from the one in which they were produced.
Typical sources:
Retry delivery.
Consumer concurrency.
Partitioning behavior.
Non-deterministic processing order.
Typical symptom:
Event B applied before Event A.
Final state becomes invalid.
In this case, the issue is temporal rather than functional. Each handler may be correct in isolation, but the system is relying on an ordering guarantee it does not actually have.
Split-brain state
Multiple services keep conflicting versions of truth.
Typical sources:
Distributed ownership boundaries.
Independent caches.
Missing reconciliation loop.
Typical symptom:
PaymentService = SUCCESS.
OrderService = PENDING.
AnalyticsService = SUCCESS.
This is one of the hardest incidents to debug because no single service is “wrong” enough to immediately stand out. Each one may be reporting a valid local state. The inconsistency only appears when the full system is viewed as one workflow.
Incident walkthrough
Here is a realistic example of how an abstraction can hide the real problem.
Scenario
A user clicks Retry payment.
Frontend
The UI performs an optimistic update:
PAID_PENDING -> PAID
The app sends the mutation request and immediately re-renders.
Backend
The API responds successfully:
POST /payments/retry -> 200 OK
The payload says:
{
  "orderId": 98122,
  "status": "PAID"
}
Database
The transaction commits correctly:
payment.status = "PAID"
Event system
The system emits:
PaymentSucceeded(eventId=E1)
Downstream consumer
The consumer receives the event, but deduplication logic treats it as a duplicate because a previous event version already exists. The update is skipped.
Cache
Redis still contains:
payment:98122 = PENDING
The TTL has not expired yet, so the stale value continues to be served.
Final result
The UI shows PENDING, the API says PAID, the DB says PAID, and the cache still says PENDING.
Why debugging was hard
Each layer looked valid in isolation:
The frontend followed its optimistic workflow.
The API returned success.
The DB committed the write.
The event was emitted.
The consumer applied its deduplication rule.
The cache had not expired yet.
The failure was not a single bug. It was a mismatch between assumptions about ownership, propagation, and freshness.
Frontend divergence
Frontend frameworks often create an implicit dual-state problem.
One state system is network-derived truth:
React Query.
RTK Query.
server responses.
The other is domain-derived truth:
Redux slices.
component state.
local cache.
These two models are not automatically synchronized. If a mutation updates one but not the other, the UI can show stale or contradictory state even when the API response is correct.
For example:
POST /api/payments/retry -> 200 OK

{
  "orderId": 98122,
  "status": "PAID"
}
But the UI still shows:
Redux store:
orders = { status: "FAILED" }

RTK Query cache:
getOrder(98122) = { status: "PAID" }
That is not just a “bad render.” It is a state ownership problem. The debugging question becomes: which layer owns the truth, and which layer forgot to reconcile?
How to debug it
The investigation usually follows this order:
Verify the API response in DevTools.
Inspect the mutation cache update.
Inspect the Redux slice separately.
Compare selector output with query cache output.
Check whether invalidation or dispatch was skipped.
The important part is that debugging is no longer centered on component code. It becomes a reconciliation exercise across state stores.
Backend event inconsistency
Event-driven systems introduce a different kind of abstraction cost.
A successful backend mutation may look like this:
emit PaymentSucceeded(eventId=E1)
But downstream processing may not be deterministic:
the consumer may receive the event later,
a deduplication rule may skip the update,
another consumer may process an older version first,
the DB may already have advanced while the consumer is still stale.
In practice, this can lead to a state like:
PaymentService = SUCCESS.
OrderService = PENDING.
AnalyticsService = SUCCESS.
The bug is not always in the event handler. Sometimes it is in the assumptions around delivery semantics, deduplication keys, or transaction timing. The abstraction makes the architecture scalable, but it also hides the timeline.
How to debug it
To reconstruct the incident, you need to compare:
producer logs,
consumer logs,
partition and offset details,
deduplication keys,
DB transaction timing.
This is why distributed tracing is so valuable in production: it restores a timeline that the abstraction otherwise hides.
Cache and freshness problems
Cache layers are among the most common sources of hidden inconsistency.
A profile update may succeed in the database but remain stale in:
Redis,
CDN,
frontend cache,
browser cache.
Example:
Database: name = "Alex"
Redis: name = "John"
React Query: staleTime = 30000
CDN: max-age = 60
Every layer is behaving according to its own freshness policy. The failure appears when those policies overlap without a single invalidation strategy.
This is one reason cache bugs are so frustrating: the cache is not broken in the abstract. It is broken relative to the business expectation that “after save, the next read should show the new value.”
What the abstraction hides
A cache abstraction usually exposes simple read/write behavior, but in production it also hides:
TTL expiration windows,
invalidation timing,
race conditions between write and read,
propagation delays between systems.
If the invalidation path is missing, stale data may persist while all logs still look clean. That is exactly why a cache bug can look like a frontend bug, a database bug, or a networking bug depending on where you start the investigation.
When abstractions help
This is the important counterbalance: abstractions are not inherently bad. They actually make debugging easier when they enforce a single ownership boundary and expose state transitions clearly.
Example: React component boundary
A local component state bug is often easier to debug than a distributed state bug because:
the state is owned by one component,
lifecycle rules are explicit,
DevTools can inspect local state,
side effects are bounded.
If a spinner does not appear after a click, the debugging path is usually short:
Check the event handler.
Check the state update.
Check memoization or stale closure issues.
Confirm render behavior.
There is no distributed reconciliation problem yet. The abstraction is helping because it reduces the number of places the bug can hide.
Example: DTO mapping layer
A service-layer mapping function can also improve debugging.
If a response is missing a field, you can inspect:
the controller response,
the service transform function,
the domain input,
the feature flag or config layer.
That is much easier than having mapping logic spread across middleware, controller code, and ad hoc response shaping. The abstraction is useful because it concentrates the transformation logic into one place.
Example: Cache boundary with clear ownership
A cache layer is easier to debug when:
the keyspace is explicit,
TTL is known,
invalidation is centralized,
read/write semantics are predictable.
In that case, a stale value often comes down to one missing invalidation step rather than a chain of unknown side effects. The abstraction helps because it creates a narrow invariant: “if the DB changes, the key must be invalidated.”
Technical concepts that matter
Several distributed-systems concepts explain why these failures happen.
Eventual consistency
Eventual consistency means the system may be temporarily inconsistent but should converge later. This is acceptable only if your product can tolerate the delay. If your UI expects read-after-write behavior, eventual consistency may produce visible bugs.
Read-after-write guarantees
Read-after-write means a user should see the effect of a successful mutation immediately on subsequent reads. When this guarantee is missing, caches and async propagation can produce stale results even when writes succeed.
Idempotency
Idempotent handlers can safely process the same event or request more than once. Without idempotency, retries can create duplicated side effects or state corruption.
Causal ordering
Causal ordering means events that depend on one another are processed in the correct sequence. Without it, a later event may be applied before an earlier one, producing invalid final state.
Distributed tracing
Distributed tracing links requests and events across services using trace IDs or span IDs. It is one of the most effective tools for reconstructing the real execution path of a system.
CAP trade-offs
In distributed systems, consistency, availability, and partition tolerance trade off against one another. Many debugging nightmares are really symptoms of an intentional architectural trade-off that was not made explicit to the team.
Practical debugging playbook
When you face a cross-layer inconsistency, debug it like a state reconstruction problem.
1. Identify state ownership
Ask which layer owns the canonical value:
UI?
Redux?
Query cache?
service layer?
database?
event consumer?
cache?
If the answer is “all of them,” the system probably has an ownership problem, not just a bug.
2. Rebuild the timeline
Trace the path of the mutation:
event,
request,
DB write,
cache update,
invalidation,
downstream propagation,
UI refresh.
The goal is to identify where the chain diverged from the expected path. A distributed trace or correlated request ID helps a lot here.
3. Classify the failure mode
Map the symptom to a category:
stale read,
lost update,
ghost update,
reorder inconsistency,
split-brain state.
This narrows the investigation faster than reading logs blindly.
4. Inspect contracts, not just code
Check whether the violated assumption is about:
freshness,
ordering,
atomicity,
invalidation,
idempotency,
deduplication.
Most incident root causes are not “logic bugs” in the narrow sense. They are contract mismatches between layers.
5. Reduce hidden duplication
If the same state exists in multiple places, ask whether all copies are necessary.
Sometimes the real fix is architectural:
remove one copy,
consolidate ownership,
tighten cache invalidation,
stop duplicating derived state,
expose the canonical source more clearly.
This is often more effective than patching symptoms in isolation.
Recommended engineering practices
If you want abstractions to help instead of hurt, make them observable and explicit.
Instrument boundaries
Add logs, traces, and metadata at every major boundary:
frontend mutation start,
API response,
DB commit,
event emission,
consumer processing,
cache invalidation.
Use trace IDs everywhere
A request ID or trace ID should follow the user action through the full system. If you cannot connect the layers, you cannot debug the incident efficiently.
Prefer explicit ownership
Each piece of state should have one clear source of truth. Everything else should be a derived copy or a cache with clear invalidation rules.
Design for retries
If retries are possible, make handlers idempotent and use stable deduplication keys.
Minimize silent disagreement
If two layers can diverge, the system should at least make that divergence visible. Silent disagreement is what makes incidents so expensive.
Design trade-offs
There is a deeper trade-off underneath all of this.
Stronger abstractions improve modularity, testability, and code reuse. But stronger distribution of state also makes consistency harder to reason about. In practice, engineering teams are balancing:
consistency vs availability,
latency vs correctness,
simplicity vs scalability,
encapsulation vs observability.
That is why distributed systems are full of patterns such as CQRS, sagas, idempotent handlers, and eventual consistency. These are not just architecture buzzwords. They are ways to manage the fact that a system can be architecturally clean while still being temporally inconsistent.
A good design does not eliminate this trade-off. It makes the trade-off explicit and debuggable.
Conclusion
Good abstractions make debugging harder when they multiply state, hide propagation rules, or allow several layers to be correct at the same time. They make debugging easier when they reduce the search space, define ownership clearly, and keep intermediate state visible. The difference is not whether abstraction exists. The difference is whether it creates a clean boundary or a distributed illusion of truth.
In real production systems, debugging is rarely about reading one function. It is about reconstructing a state transition across multiple owners, caches, and asynchronous paths. The best abstractions do not hide that reality. They make it smaller, more observable, and easier to reason about.
Key takeaways
Multiple locally correct layers can still produce a globally wrong system.
The hardest bugs often come from ownership ambiguity, cache incoherence, or event ordering assumptions.
Abstractions help when they narrow the search space and expose state transitions.
Abstractions hurt when they duplicate state and hide propagation rules.
Debugging distributed systems is mostly a problem of timeline reconstruction and contract verification.